Nap Joseph Calub

Software Engineer and Open Source Enthusiast

Create a 3D Contribution Chart Using React Three Fiber

Published on April 2, 2023

3D

In this tutorial, we will create a 3D grid visualization of our timeseries data using React Three Fiber, a React renderer for Three.js. By following these steps, you'll gain a deeper understanding of how to work with time-series data, create compelling visualizations, and customize them in real-time.

Project Titan

As this is a lengthy post, here's a table of contents to help you navigate:

##Step 1: Project Setup

In this initial step, we will create a new project utilizing Create T3 App. If you already have a React project in place, simply install the additional dependencies mentioned below and proceed to the following step.

###Prerequisites

First, install a version manager for Node.js compatible with your operating system:

After installing nvm, install the latest LTS version of node by executing:

# Linux/macOS
$ nvm install --lts
# Windows
$ nvm install lts

Next, we'll install pnpm, a faster and more efficient alternative to npm. To install pnpm, run:

$ npm install -g pnpm

###Create a new Next.js project

For our project, we'll use Create T3 App, a command-line tool that helps you generate a new React project with pre-configured setups for Next.js, TypeScript, and Tailwind CSS.

To create a new T3 project, execute:

$ pnpm create t3-app@latest
# ___ ___ ___ __ _____ ___ _____ ____ __ ___ ___
# / __| _ \ __| / \_ _| __| |_ _|__ / / \ | _ \ _ \
# | (__| / _| / /\ \| | | _| | | |_ \ / /\ \| _/ _/
# \___|_|_\___|_/¯¯\_\_| |___| |_| |___/ /_/¯¯\_\_| |_|
# ? What will your project be called? (my-t3-app) titan
# ? Will you be using JavaScript or TypeScript? TypeScript
# ? Which packages would you like to enable? tailwind
# ? Initialize a new git repository? (Y/n) Yes
# ? Would you like us to run pnpm install? (Y/n) Yes
# ? What import alias would you like configured? ~/
#
# ✔ titan scaffolded successfully!

You can choose any project name you prefer. For this guide, we'll use titan, which is inspired by a character in The Wandering Inn, one of the longest pieces of English fiction. The author has been consistently writing since 2016, and we'll use their writing data for our visualization.

###Install Additional Project Dependencies

Once the project is created, navigate to the project directory:

$ cd titan

Now, install the necessary dependencies for our project:

$ pnpm add three @types/three @react-three/fiber @react-three/drei leva date-fns yaml
  • three is a JavaScript 3D library that we will use to create our 3D visualization.
  • @types/three provides TypeScript type definitions for three.
  • @react-three/fiber serves as a React renderer for three.
  • @react-three/drei offers a suite of React components for @react-three/fiber.
  • leva is a GUI library for building controls for our visualization.
  • date-fns is a date utility library for parsing and formatting dates.
  • yaml is a YAML data parser.

###Clean up the Home Page

Open the project directory in your preferred code editor and replace the contents of src/pages/index.tsx with the following code:

src/pages/index.tsx

import type { NextPage } from 'next';
import Head from 'next/head';
const Home: NextPage = () => {
return (
<>
<Head>
<title>Titan</title>
<meta name="description" content="Visualize contribution charts in 3D" />
<link rel="icon" href="/favicon.ico" />
</Head>
<main className="h-screen w-screen p-1">
<nav className="absolute left-1/2 z-10 mx-auto my-4 -translate-x-1/2 text-center text-4xl font-bold">
Titan
</nav>
</main>
</>
);
};
export default Home;

Update the look of your body tag by modifying src/styles/globals.css:

src/styles/globals.css

@tailwind base;
@tailwind components;
@tailwind utilities;
@layer base {
body {
@apply bg-gray-100;
}
}

Finally, start the development server by running:

$ pnpm dev

You should now see an empty page with the project name at the top.

Empty Page

##Step 2: Preparing our Data

In this step, we'll fetch our data from The Wandering Inndex, a community-driven project that compiles and analyzes data about The Wandering Inn for public access. The raw data for the published chapters is in YAML format, and we'll use the yaml package to parse it and convert it to our desired format.

###Creating the Type Definitions

In TypeScript, type declarations define the structure of objects, interfaces, classes, and functions. This enhances clarity and documentation within the codebase, making it more comprehensible and maintainable for developers.

First, let's declare the type definitions for our application. Conveniently, the data we're working with already has type definitions available available. We'll use the Chapter interface, which represents data about individual chapters. Since we'll only use a portion of the available fields from the complete type definitions, create a new file at src/types/chapters.ts and insert the following code:

src/types/chapters.ts

/** Minimal interface that represents the individual Chapter data. */
export interface Chapter {
/** Unique ID for the chapter. */
id: string;
/** Flags for the chapter. */
meta: {
/** If true, then it will be shown in the table of contents. */
show: boolean;
};
/** Specifies that a chapter is part of a bigger collection. */
partOf: {
/** Part of a Web Novel Volume. */
webNovel?: {
/** The volume this is collected under. */
ref: number | null;
/**
* The timestamp when this chapter is originally published. This can be
* found via the `meta[property='article:published_time']` selector.
*/
published: string | null;
/**
* Total words based on https://wordcounter.net/. Without the title,
* author's notes, artworks, etc.
*/
totalWords: number | null;
};
};
}

We want to display chapters that are being shown in the Table of Contents page (meta.show === true) and are part of a Web Novel Volume (partOf.webNovel.ref > 0). Additionally, we'll use the partOf.webNovel.published field to determine the chapter's publication date and the partOf.webNovel.totalWords field to identify the chapter's word count.

Next, create the type definitions for our time-related data. Create src/types/calendar.ts and include the following:

src/types/calendar.ts

// TODO: Add type definition for `CalendarWeekData`.
// TODO: Add type definition for `CalendarYearData`.
// TODO: Add type definition for `CalendarYearsData`.
/**
* Maps a value per date string.
* The date string must be in a valid ISO 8601 format.
*
* @see https://en.wikipedia.org/wiki/ISO_8601
*
* @example
* const map: ValuesPerDay = new Map<string, number>([
* ["2021-01-01", 1000],
* ["2021-01-02", 2000],
* ["2021-01-03", 3000],
* ]);
*/
export type ValuesPerDay = Map<string, number>;

Then, create a src/types/index.ts file and insert the following code:

src/types/index.ts

export * from './calendar';
export * from './chapters';

This allows us to import all our types from a single location (e.g. import { ValuesPerDay } from "~/types/";).

Our goal for this step is to transform the Chapter data into a mapping of word counts by date (ValuesPerDay).

###Convert the Chapter data to a mapping of dates to values

Now, create a src/utils/chapters.ts file and add the following code:

src/utils/chapters.ts

import { isMatch, formatISO, parseISO } from 'date-fns';
import type { Chapter, ValuesPerDay } from '~/types';
/**
* Checks if a chapter should be included based on the given conditions.
*
* @param {Chapter} chapter - The chapter to check.
* @returns {boolean} - `true` if the chapter should be included, `false`
* otherwise.
*/
export const shouldIncludeChapter = (chapter: Chapter): boolean => {
const shouldShow = chapter.meta.show === true;
const hasValidWebNovelRef = (chapter.partOf.webNovel?.ref ?? 0) > 0;
const hasValidPublishedDate = isMatch(
chapter.partOf.webNovel?.published ?? '',
"yyyy-MM-dd'T'HH:mm:ssXXX"
);
return shouldShow && hasValidWebNovelRef && hasValidPublishedDate;
};
/** The return data from the `convertChaptersToMapping` function. */
export interface ConvertChaptersToMappingOutput {
/** This maps a date string to the number of words written on that day. */
mapping: ValuesPerDay;
/** The minimum year in the dataset. */
minYear: number;
/** The maximum year in the dataset. */
maxYear: number;
/** The minimum value in the dataset. */
minValue: number;
/** The maximum value in the dataset. */
maxValue: number;
}
/**
* Converts an array of `Chapter` objects to a `ConvertChaptersToMappingOutput`.
*
* @param {Chapter[]} chapters - The array of `Chapter` objects.
* @returns {ConvertChaptersToMappingOutput} - The output of the conversion.
*/
export const convertChaptersToMapping = (chapters: Chapter[]): ConvertChaptersToMappingOutput => {
const mapping: ValuesPerDay = new Map();
let minYear = Number.POSITIVE_INFINITY;
let maxYear = Number.NEGATIVE_INFINITY;
let minValue = Number.POSITIVE_INFINITY;
let maxValue = Number.NEGATIVE_INFINITY;
for (const chapter of chapters) {
if (!shouldIncludeChapter(chapter)) {
continue;
}
const publishedDate = chapter.partOf.webNovel?.published ?? '';
const totalWords = chapter.partOf.webNovel?.totalWords ?? 0;
if (publishedDate) {
const date = parseISO(publishedDate);
const dateKey = formatISO(date, {
representation: 'date'
});
const existingWordCount = mapping.get(dateKey) ?? 0;
const newWordCount = existingWordCount + totalWords;
mapping.set(dateKey, newWordCount);
const year = date.getFullYear();
minYear = Math.min(minYear, year);
maxYear = Math.max(maxYear, year);
minValue = Math.min(minValue, newWordCount);
maxValue = Math.max(maxValue, newWordCount);
}
}
return { mapping, minYear, maxYear, minValue, maxValue };
};

This file contains a utility function that converts our Chapter data into a mapping of dates to word counts (ValuesPerDay). The code is relatively straightforward, but let's examine it more closely.

First, we define a shouldIncludeChapter function to verify whether a chapter should be included based on specific conditions. This function returns true if the chapter meets the conditions and false otherwise. The conditions are:

  • chapter.meta.show must be true.
  • chapter.partOf.webNovel.ref must be greater than 0.
  • chapter.partOf.webNovel.published must be a valid date string.

Next, we define a convertChaptersToMapping function that converts an array of Chapter objects to an object with the following properties:

  • mapping: This maps a date string to the number of words written on that day.
  • minYear: The earliest year in the dataset.
  • maxYear: The latest year in the dataset.
  • minValue: The smallest value in the dataset.
  • maxValue: The largest value in the dataset.

The function iterates through each Chapter, verifying if it should be included. If so, it adds the number of words written on that day to the mapping. It also updates the minYear, maxYear, minValue, and maxValue properties as needed.

Finally, let's create a src/utils/index.ts file and add the following code:

src/utils/index.ts

export * from './chapters';

###Show the parsed Chapter data on the page

Update the src/pages/index.tsx page to fetch our Chapter data from the source repository. Then, use the convertChaptersToMapping function to convert the data and display the relevant information on the page.

src/pages/index.tsx

import type { NextPage, GetServerSideProps } from 'next';
import Head from 'next/head';
import { parse as parseYaml } from 'yaml';
import { convertChaptersToMapping } from '~/utils';
import type { Chapter } from '~/types';
const URL = `https://raw.githubusercontent.com/wandering-inndex/seed-data/main/data/media/twi-webnovel-chapters.yaml`;
interface HomeProps {
/** The minimum year in the dataset. */
minYear: number;
/** The maximum year in the dataset. */
maxYear: number;
/** The minimum value in the dataset. */
minValue: number;
/** The maximum value in the dataset. */
maxValue: number;
}
const Home: NextPage<HomeProps> = ({ minYear, maxYear, minValue, maxValue }) => {
return (
<>
<Head>
<title>Titan</title>
<meta name="description" content="Visualize contribution charts in 3D" />
<link rel="icon" href="/favicon.ico" />
</Head>
<main className="h-screen w-screen p-1">
<nav className="absolute left-1/2 z-10 mx-auto my-4 -translate-x-1/2 text-center text-4xl font-bold">
Titan
</nav>
<ul>
<li>Minimum Year: {minYear}</li>
<li>Maximum Year: {maxYear}</li>
<li>Minimum Value: {minValue.toLocaleString('en-US')}</li>
<li>Maximum Value: {maxValue.toLocaleString('en-US')}</li>
</ul>
</main>
</>
);
};
export const getServerSideProps: GetServerSideProps<HomeProps> = async () => {
const res = await fetch(URL);
const text = await res.text();
const chapters: Chapter[] = parseYaml(text) as Chapter[];
const { minYear, maxYear, minValue, maxValue } = convertChaptersToMapping(chapters);
return {
props: {
minYear,
maxYear,
minValue,
maxValue
}
};
};
export default Home;

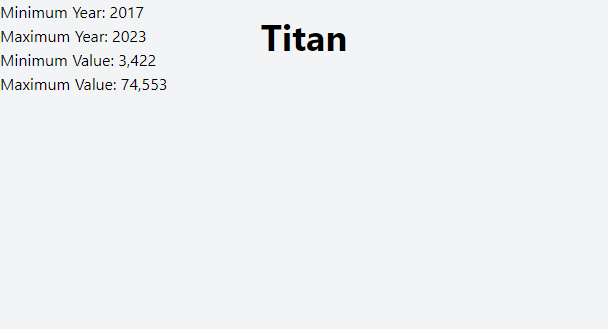
getServerSideProps is a unique Next.js function that runs on the server before the page is rendered. We use this function to fetch the YAML data from our data source. We then convert the data to a mapping of dates to values using the convertChaptersToMapping function we created earlier. We return the outputs as props to our Home page component, displaying the values as a simple HTML unordered list.

With Values

##Step 3: Creating the Time-series Data

In this step, we'll organize the data by year and week. This process involves creating utility functions that calculate the week numbers using a modified ISO 8601 standard.

###Defining the Time-series Data Types

First, let's update the src/types/calendar.ts file to define the data structure we will use to visualize the data. Add the following code to the top:

src/types/calendar.ts

/**
* Represents a tuple of a given type `T` and fixed length `N`.
*
* @see https://stackoverflow.com/a/74801694
*/
type Tuple<T, N extends number, R extends T[] = []> = number extends N
? T[]
: R['length'] extends N
? R
: Tuple<T, N, [T, ...R]>;
/**
* An array that represents values per day of the week.
*
* For this project, the first day of the week will be Monday, as per ISO 8601:
*
* - INDEX 0: MON
* - INDEX 1: TUE
* - INDEX 2: WED
* - INDEX 3: THU
* - INDEX 4: FRI
* - INDEX 5: SAT
* - INDEX 6: SUN
*
* @see https://en.wikipedia.org/wiki/ISO_8601
*
* If there are no values for that specific day, it will be 0.
* If that day is not part of the calendar year, it will be -1.
*
* @example
* const week: CalendarWeekData = [1000, 2000, 3000, 4000, 5000, 6000, 7000];
* const weekWithoutValues: CalendarYearData = [0, 0, 0, 0, 0, 0, 0];
* const weekWithDaysNotInYear: CalendarYearData = [-1, -1, -1, -1, -1, -1, -1];
* const weekMixed: CalendarYearData = [-1, -1, 0, 0, 5000, 0, 7000];
*/
export type CalendarWeekData = Tuple<number, 7>;
/**
* An array that represents values per week of the year.
*
* Most years have 52 weeks, but if the year starts on a Thursday or is a leap
* year that starts on a Wednesday, that particular year will have 53 weeks.
*
* In ISO 8601, if January 1 is on a Monday, Tuesday, Wednesday, or Thursday, it
* is in week 1. If January 1 is on a Friday, Saturday or Sunday, it is in week
* 52 or 53 of the previous year (there is no week 0). December 28 will always
* be in the last week of its year.
*
* @see https://en.wikipedia.org/wiki/ISO_8601
*
* For this project:
*
* - We will *ALWAYS* create a 54-week year.
* - If a date's month is January and its week number is greater than 50, it
* will be changed to week 0.
* - If a date's month is December and its week number is less than 10, it
* will be changed to the number of ISO 8601 weeks in that year + 1. The total
* weeks will be coming from to `date-fns`:
* {@link https://date-fns.org/docs/getISOWeeksInYear}
*/
export type CalendarYearData = Array<CalendarWeekData>;
/** An array that represents values per year. */
export type CalendarYearsData = Array<CalendarYearData>;
// ...
//
// Definition for `ValuesPerDay`

Our objective is to transform the ValuesPerDay mapping we created previosly into an array of CalendarYearData. A CalendarYearData consists of an array of CalendarWeekData values, which are themselves arrays of word counts per week.

To help visualize this multi-dimensional array, imagine a 2D grid where one axis represents the week number, another axis represents the day of the week, and the cell value represents the word count.

Year Grid

Some key points to note about this grid:

  • The week starts on Monday (index 0) and ends on Sunday (index 6).
  • There are 54 weeks (indexes 0 to 53) instead of the usual 52 or 53 weeks.

It's essential to recognize that the start of the week varies across cultures, as does the number of weeks in a year. Some years have 52 weeks, while others have 53 weeks during leap years. Additionally, since the start of the week can differ, the number of weeks can also vary. In this project, we will use the ISO 8601 standard standard as our basis, with some modifications.

###Gregorian Calendar vs ISO 8601 Calendar

ISO 8601 is a standard that defines how to represent dates and times. For further information, check out the articles for ISO 8601, ISO week date, and ISO-8601 Week-Based Calendar.

Here are some key differences between the Gregorian Calendar and the ISO 8601 Calendar:

Gregorian CalendarISO 8601 Calendar
The year always starts on January 1.The year starts on the first Monday closest to January 1, meaning the year may begin anywhere between December 29 and January 4.
Weeks can extend across years.Each week has exactly 7 days, starts on Monday, and belongs to a single year.
Years can have 365 or 366 days.A year has 52 or 53 full weeks, which is 364 or 371 days.

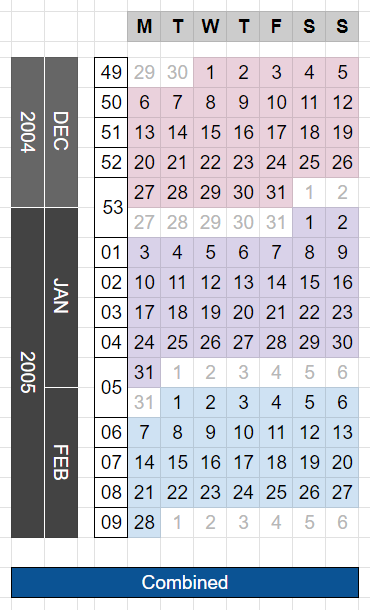
The following example demonstrates the difference when transitioning from December 2004 to January 2005. The Gregorian Calendar starts the year on January 1, while the ISO 8601 Calendar starts the year on January 3.

Different Calendars

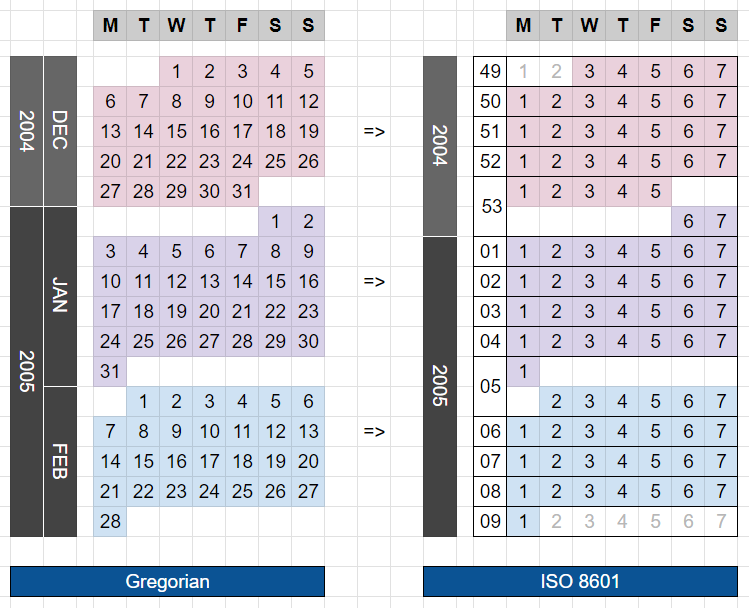
Calendar applications typically use the Gregorian calendar but offer the option to show ISO 8601 week numbers.

Combined Calendars

###Modified Version

While ISO 8601 is a valuable standard, we must modify it to suit our needs:

  • Our year will always have 54 weeks (378 days), ensuring all years have the same number of columns when displayed side-by-side in grids.
    • The extra week will be placed at the beginning, assigned an index of 0.
  • The week number will follow the ISO 8601 standard, with a few exceptions:
    • If the date's month is January, but the ISO week number is greater than 50, change the week number to 0.
    • If the date's month is December, but the ISO week number is less than 10, change the week number to the last ISO 8601 week number of that year plus 1.
  • Our weeks will start on Monday, with days having 0-based indexes, so Monday will be 0 and Sunday will be 6.
  • In our data structure, the word counts for each week will be represented as an array of 7 numbers. If the week has unused slots, the values for those days will be represented as negative numbers.

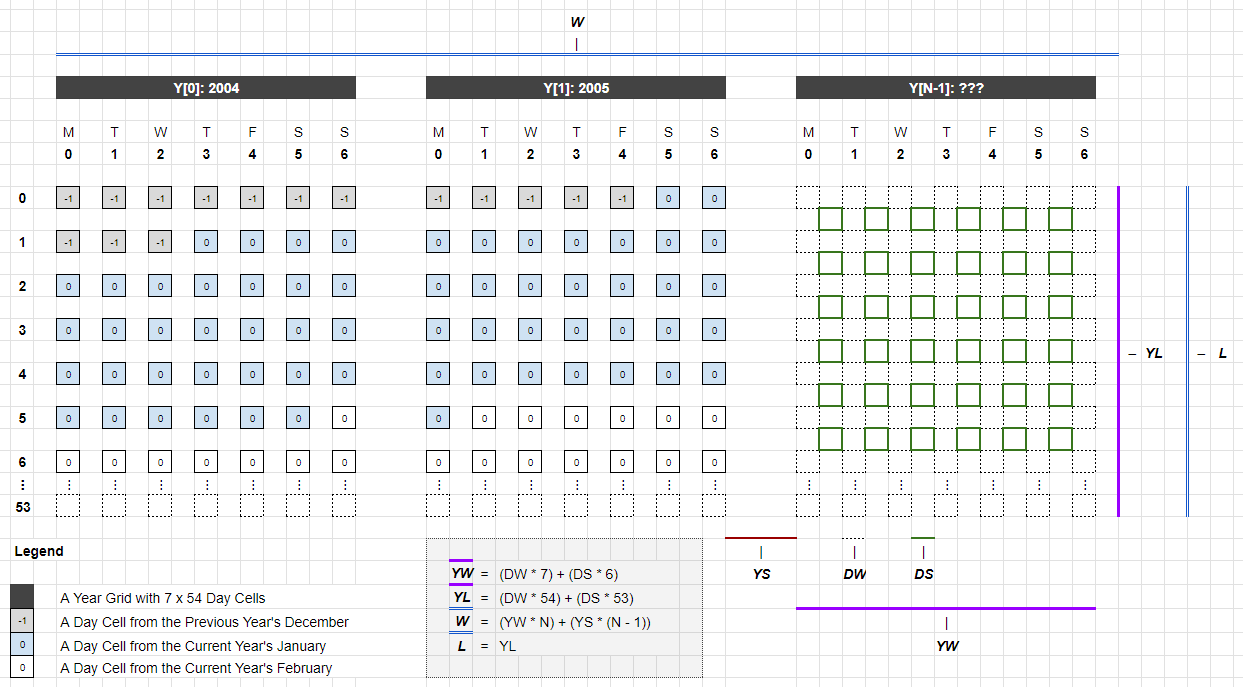
Let's visualize this modified calendar:

Combined and Modified Calendars

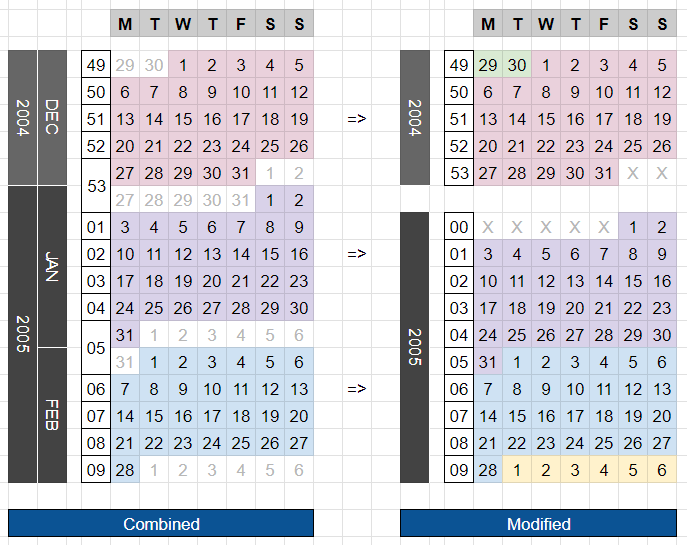
In 2004, Week 53 will end with two unused days at the end (marked as X in the chart). In 2005, Week 0 will start with five unused days at the beginning (marked as X in the chart), and Week 1 will start on January 3. If we continue and fill up our grid for the year 2005 with our dates, we will get:

Year 2005 Grid

In our data structure, we will initialize the grid with negative numbers for the unused days and 0 for the rest:
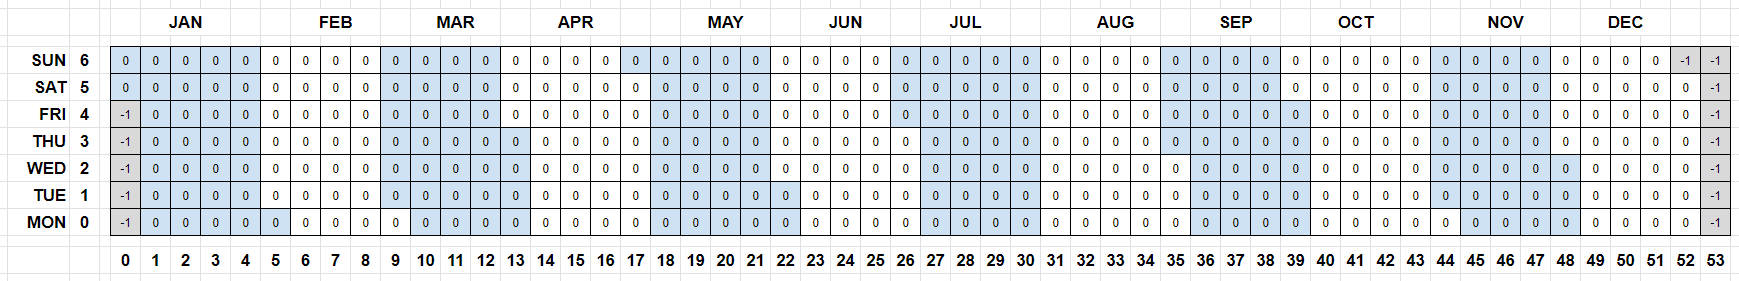
Year 2005 Grid Initialized

###Using date-fns

We'll use the date-fns library to simplify our ISO 8601 calculations. We will use the getISOWeek function to get the week number for a given date, and the getISOWeeksInYear function to get the number of weeks in a given year. We can get the day index by using the getDay function and subtracting 1 from the result.

Let's try checking the values for 2004-12-28 to 2005-01-04:

import {
formatISO,
getDay,
getISODay,
getISOWeek,
getISOWeeksInYear,
getISOWeekYear
} from 'date-fns';
const newDate = (year: number, month: number, day: number): Date => {
// The month is 0-based, so January is 0 and December is 11.
return new Date(year, month - 1, day, 0, 0, 0, 0);
};
const analyzeDate = (date: Date) => {
return {
// Extracts the YYYY-MM-DD portion of the Date object.
formattedDate: formatISO(date, { representation: 'date' }),
// The day of the week, 0-6, where Sunday is the first day of the week.
gregDay: getDay(date),
// The day of the week, 1-7, where Monday is the first day of the week.
isoDay: getISODay(date),
// The year of the date.
gregYear: date.getFullYear(),
// The ISO week-numbering year of the date.
isoWeekYear: getISOWeekYear(date),
// The ISO week-numbering week of the date.
isoWeek: getISOWeek(date),
// The number of weeks in the ISO week-numbering year.
isoWeeksInYear: getISOWeeksInYear(date)
};
};
console.table([
analyzeDate(newDate(2004, 12, 28)),
analyzeDate(newDate(2004, 12, 29)),
analyzeDate(newDate(2004, 12, 30)),
analyzeDate(newDate(2004, 12, 31)),
analyzeDate(newDate(2005, 1, 1)),
analyzeDate(newDate(2005, 1, 2)),
analyzeDate(newDate(2005, 1, 3)),
analyzeDate(newDate(2005, 1, 4))
]);
(index)formattedDategregDayisoDaygregYearisoWeekYearisoWeekisoWeeksInYear
0"2004-12-28"22200420045353
1"2004-12-29"33200420045353
2"2004-12-30"44200420045353
3"2004-12-31"55200420045353
4"2005-01-01"66200520045353
5"2005-01-02"07200520045353
6"2005-01-03"1120052005152
7"2005-01-04"2220052005152

###Converting the ValuesPerDay mapping to our desired data structure

Now let's build a function to convert our ValuesPerDay mapping into an array of CalendarYearData. First, create a src/utils/calendar.ts file and include the following code:

src/utils/calendar.ts

import { getISODay, getISOWeek, getISOWeeksInYear, getYear, parseISO } from 'date-fns';
import type { CalendarWeekData, CalendarYearData, CalendarYearsData, ValuesPerDay } from '~/types';
/** Creates a UTC date. */
export const createUtcDate = (year: number, month: number, day: number) =>
new Date(Date.UTC(year, month - 1, day, 0, 0, 0, 0));
/**
* Extracts the minimum and maximum years from the given `ValuesPerDay`
* object.
*
* @param valuesPerDay - The `ValuesPerDay` object to extract the year
* range from.
* @returns An object containing the `minimumYear` and `maximumYear`.
*/
export const extractYearRange = (
valuesPerDay: ValuesPerDay
): { minimumYear: number; maximumYear: number } => {
let minimumYear = Infinity;
let maximumYear = -Infinity;
for (const dateString of valuesPerDay.keys()) {
const year = getYear(parseISO(dateString));
minimumYear = Math.min(minimumYear, year);
maximumYear = Math.max(maximumYear, year);
}
return { minimumYear, maximumYear };
};
/**
* Given a date, get its adjusted ISO week number based on the project
* requirements:
*
* - If a date's month is January and its week number is greater than 50, it
* will be changed to week 0.
* - If a date's month is December and its week number is less than 10, it
* will be changed to the number of ISO 8601 weeks in that year + 1.
*
* @param {Date} date - The date to get the adjusted ISO week number for.
* @returns {number} - The adjusted ISO week number.
*/
export const getAdjustedISOWeek = (date: Date): number => {
const month = date.getMonth();
const isoWeek = getISOWeek(date);
const isoWeeksInYear = getISOWeeksInYear(date);
if (month === 0 && isoWeek > 50) {
return 0;
} else if (month === 11 && isoWeek < 10) {
return isoWeeksInYear + 1;
}
return isoWeek;
};
/**
* Initializes an empty `CalendarYearData`.
*
* If there are no values for that specific day, it will be `0`. If that day is
* not part of the calendar year, it will be `-1`.
*
* @param {number} year - The year to initialize the data for.
* @returns {CalendarYearData} a `CalendarYearData` with default values.
*/
export const initializeEmptyCalendarYearData = (year: number): CalendarYearData => {
const firstDateOfYear = createUtcDate(year, 1, 1);
const lastDateOfYear = createUtcDate(year, 12, 31);
const firstWeekOfYearAdjusted = getAdjustedISOWeek(firstDateOfYear);
const lastWeekOfYearAdjusted = getAdjustedISOWeek(lastDateOfYear);
const firstDayOfYear = getISODay(firstDateOfYear) - 1;
const lastDayOfYear = getISODay(lastDateOfYear) - 1;
const yearData: CalendarYearData = [
...(Array.from(
{ length: 54 },
(_, weekIndex) =>
Array.from({ length: 7 }, (_, dayIndex) => {
if (
(weekIndex === firstWeekOfYearAdjusted && dayIndex < firstDayOfYear) ||
(weekIndex === lastWeekOfYearAdjusted && dayIndex > lastDayOfYear)
) {
return -1;
} else if (weekIndex < firstWeekOfYearAdjusted || weekIndex > lastWeekOfYearAdjusted) {
return -1;
} else {
return 0;
}
}) as CalendarWeekData
) as CalendarYearData)
];
return yearData;
};
/**
* Converts a `ValuesPerDay` object to a `CalendarYearsData` object.
*
* @param valuesPerDay - The `ValuesPerDay` object to convert.
* @returns The converted `CalendarYearsData` object.
*/
export const convertToCalendarYearData = (valuesPerDay: ValuesPerDay): CalendarYearsData => {
const { minimumYear, maximumYear } = extractYearRange(valuesPerDay);
const yearsData: CalendarYearsData = [];
for (let year = minimumYear; year <= maximumYear; year++) {
yearsData.push(initializeEmptyCalendarYearData(year));
}
for (const [dateString, value] of valuesPerDay) {
const date = parseISO(dateString);
const year = getYear(date);
const yearIndex = year - minimumYear;
const weekIndex = getAdjustedISOWeek(date);
const dayIndex = getISODay(date) - 1;
const yearData = yearsData[yearIndex];
if (!yearData) continue;
const weekData = yearData[weekIndex];
if (!weekData || weekData[dayIndex] === -1) continue;
weekData[dayIndex] = (weekData[dayIndex] ?? 0) + value;
}
return yearsData;
};

Remember to export the functions in the src/utils/index.ts file:

src/utils/index.ts

// ...
export * from './calendar';

Let's recap the purpose of each function:

  • createUtcDate: This function generates a UTC date object using the given year, month, and day as input. It takes these values, creates a new Date object, and sets the time components to 0 (midnight). By using Date.UTC, the date is represented in the UTC timezone.
  • extractYearRange: Given a ValuesPerDay object, this function iterates through the date strings and determines the minimum and maximum years. It initializes the minimum year to Infinity and the maximum year to -Infinity. For each date string, the function parses the date, extracts the year, and updates the minimum and maximum years as needed.
  • getAdjustedISOWeek: This function computes an adjusted ISO week number for a specific date based on the project requirements. First, it retrieves the month and ISO week number of the input date. Then, it checks if the date meets certain conditions (i.e., January with a week number greater than 50 or December with a week number less than 10). If the date satisfies any of these conditions, the adjusted week number is returned; otherwise, the original week number is returned.
  • initializeEmptyCalendarYearData: This function initializes an empty CalendarYearData object for a specified year. It calculates the first and last dates of the year, along with their adjusted ISO week numbers and ISO day numbers (subtracting 1 for a 0-based index). Then, it creates an array of 54 weeks (the maximum possible number of weeks in a year), where each week is an array of 7 days. Days that are part of the calendar year are filled with 0, while days that are not part of the calendar year are filled with -1, using the calculated week and day numbers.
  • convertToCalendarYearData: This function transforms a ValuesPerDay object into an array of CalendarYearData values. First, it uses the extractYearRange function to determine the minimum and maximum years from the input data. Then, for each year in the range, it initializes an empty CalendarYearsData object using the initializeEmptyCalendarYearData function. Next, it iterates through the input data, parsing the date strings and calculating the year, week, and day indexes. Finally, it adds the value to the appropriate day in the corresponding CalendarYearData.

##Step 4: Show the data in a 2D Grid

With the data converted, we can now create a 2D grid for each year to visualize it in a calendar-like format.

First, create a new file named src/components/FlatGrids.tsx and insert the following code:

src/components/FlatGrids.tsx

import type { FC } from 'react';
import type { CalendarWeekData, CalendarYearData, CalendarYearsData } from '~/types';
const DAYS = ['M', 'T', 'W', 'T', 'F', 'S', 'S'];
const YearTable: FC<{
year: number;
data: CalendarYearData;
}> = ({ year, data }) => {
return (
<table className="table-auto text-center">
<caption className="text-xl">{year}</caption>
<thead className="sticky top-0">
<tr className="uppercase">
<th></th>
{DAYS.map((week, index) => {
return (
<th key={`week-${index}`} className="min-w-[50px] border bg-gray-600 text-gray-200">
{week}
</th>
);
})}
</tr>
</thead>
<tbody>
{data.map((week, index) => {
return <WeekRow key={`week-${index}`} week={index} data={week} />;
})}
</tbody>
</table>
);
};
const WeekRow: FC<{ week: number; data: CalendarWeekData }> = ({ week, data }) => {
return (
<tr>
<td className="px-3 py-1 text-sm">{week.toString().padStart(2, '0')}</td>
{data.map((dayValue, index) => {
return (
<td
key={`day-${index}`}
className={`border px-2 py-1 ${dayValue < 0 ? 'bg-gray-200' : 'bg-white'}`}
>
{dayValue >= 0 && dayValue.toLocaleString('en-US')}
</td>
);
})}
</tr>
);
};
const FlatGrids: FC<{
data: CalendarYearsData;
startYear: number;
}> = ({ data, startYear }) => {
return (
<div>
{data.map((yearData, index) => {
const year = startYear + index;
return <YearTable key={`year-${year}`} year={year} data={yearData} />;
})}
</div>
);
};
export default FlatGrids;

Now, incorporate the FlatGrids component into the Home Page:

src/pages/index.tsx

import type { NextPage, GetServerSideProps } from 'next';
import Head from 'next/head';
import { parse as parseYaml } from 'yaml';
import { convertChaptersToMapping, convertToCalendarYearData } from '~/utils';
import type { Chapter, CalendarYearsData } from '~/types';
import FlatGrids from '~/components/FlatGrids';
const URL = `https://raw.githubusercontent.com/wandering-inndex/seed-data/main/data/media/twi-webnovel-chapters.yaml`;
interface HomeProps {
/** The list of word counts per calendar year. */
data: CalendarYearsData;
/** The minimum year in the dataset. */
minYear: number;
/** The maximum year in the dataset. */
maxYear: number;
/** The minimum value in the dataset. */
minValue: number;
/** The maximum value in the dataset. */
maxValue: number;
}
const Home: NextPage<HomeProps> = ({ data, minYear, maxYear, minValue, maxValue }) => {
return (
<>
<Head>
<title>Titan</title>
<meta name="description" content="Visualize contribution charts in 3D" />
<link rel="icon" href="/favicon.ico" />
</Head>
<main className="h-screen w-screen p-1">
<nav className="absolute left-1/2 z-10 mx-auto my-4 -translate-x-1/2 text-center text-4xl font-bold">
Titan
</nav>
<ul>
<li>Minimum Year: {minYear}</li>
<li>Maximum Year: {maxYear}</li>
<li>Minimum Value: {minValue.toLocaleString('en-US')}</li>
<li>Maximum Value: {maxValue.toLocaleString('en-US')}</li>
</ul>
<FlatGrids data={data} startYear={minYear} />
</main>
</>
);
};
export const getServerSideProps: GetServerSideProps<HomeProps> = async () => {
const res = await fetch(URL);
const text = await res.text();
const chapters: Chapter[] = parseYaml(text) as Chapter[];
const { mapping, minYear, maxYear, minValue, maxValue } = convertChaptersToMapping(chapters);
const data = convertToCalendarYearData(mapping);
return {
props: {
data,
minYear,
maxYear,
minValue,
maxValue
}
};
};
export default Home;

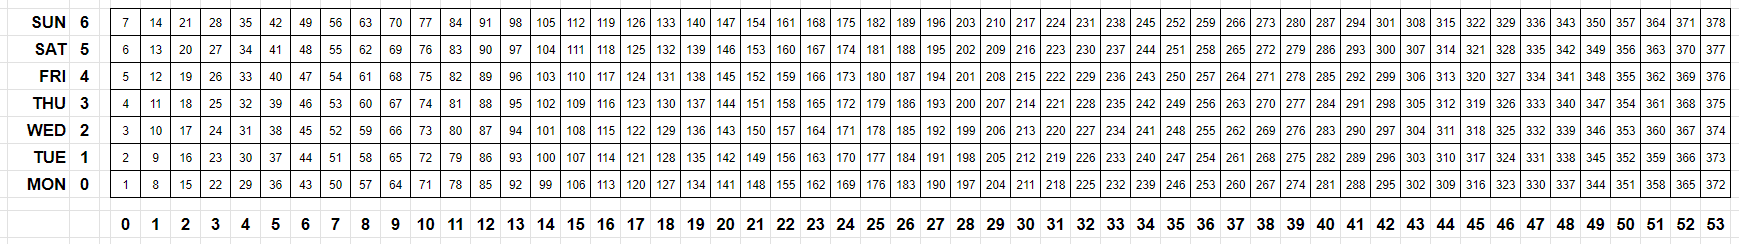
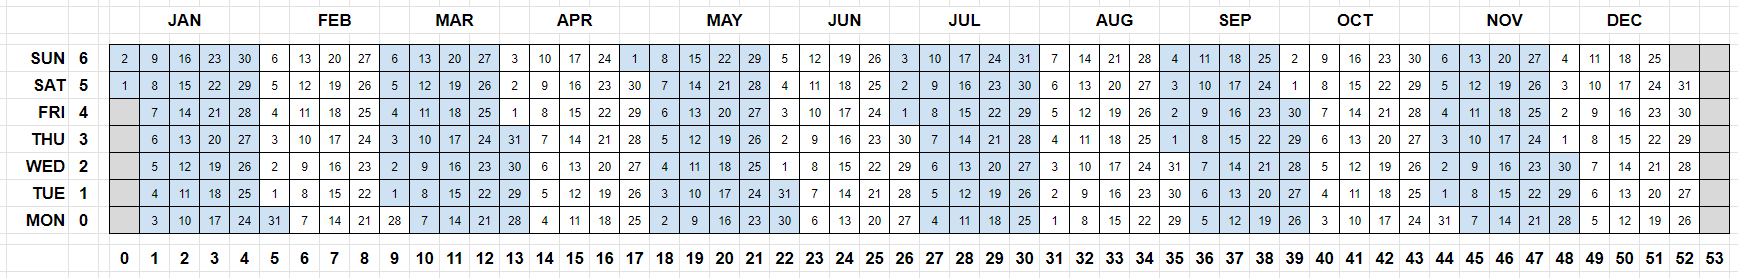
Once you save the changes, you'll be able to see the values in a 2D grid:

Show Tables Per Year

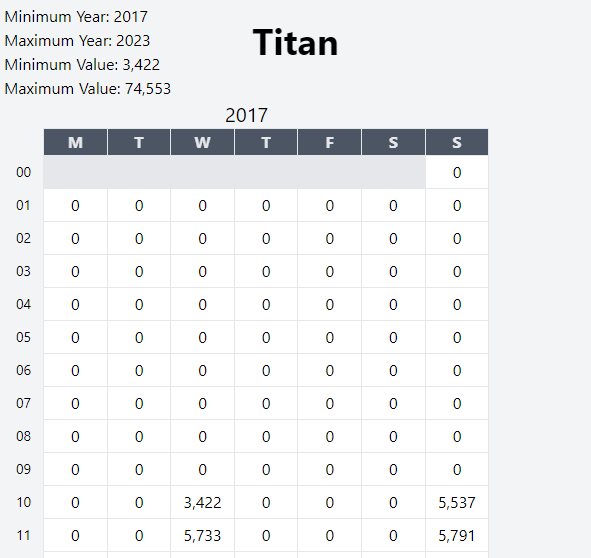
Our code will display a simple table for each year, with week numbers on the left, days of the week on the top, and word counts in the cells. Cells with unused slots (negative values) will have a gray background.

##Step 5: Show the Data in a 3D Grid

Now, it's time to bring our visualization into the third dimension!

First, create a custom hook at src/hooks/useGridCalculations.ts to calculate the grid parameters:

src/hooks/useGridCalculations.ts

import { useMemo } from 'react';
import type { CalendarYearsData } from '~/types';
/** Creates a set of calculations for the grid. */
export const useGridCalculations = (
/** The data to be used for the calculations. */
data: CalendarYearsData,
/** The spacing between the grids. */
gridSpacing: number,
/** The length of each cell in the grid. */
cellSize: number,
/** The spacing between the cells. */
cellSpacing: number,
/** The scale of the cells. */
scale: number,
/** The maximum value of the data. */
maxValue: number
) => {
return useMemo(() => {
/** Calculates the distance of a cell from the origin. */
const cellDistance = (items: number): number => {
// prettier-ignore
return (cellSize * items) + (cellSpacing * (items - 1));
};
/** Calculates the distance of grid from the origin. */
const gridDistance = (items: number): number => {
// prettier-ignore
return (gridWidth * items) + (gridSpacing * (items - 1));
};
/** Calculates the scaled height of the cells based on the maximum value. */
const calcCellHeight = (value: number) => {
return value >= 0 ? (value / maxValue) * scale : 0;
};
/** Calculates the adjusted starting position of a cell. */
const calcCellPosition = (index: number): number => {
// prettier-ignore
return ((cellSize + cellSpacing) * index) + (cellSize / 2);
};
/** Calculates the starting position of the grid. */
const calcGridPosition = (index: number): [number, number, number] => {
return [(cellDistance(7) + gridSpacing) * index, 0, 0];
};
const gridWidth = cellDistance(7);
const gridLength = cellDistance(54);
const totalWidth = gridDistance(data.length);
const totalLength = gridLength;
/** The center of the Canvas. */
const center: [number, number, number] = [totalWidth / 2, 0, totalLength / 2];
return { calcCellHeight, calcGridPosition, calcCellPosition, center };
}, [data, gridSpacing, cellSize, cellSpacing, maxValue, scale]);
};

Don't forget to export it from src/hooks/index.ts:

src/hooks/index.ts

export * from './useGridCalculations';

After that, create a new file called src/components/TitanicGrids.tsx and add the following code:

src/components/TitanicGrids.tsximport

import { Canvas } from '@react-three/fiber';
import { Box, PerspectiveCamera, OrbitControls } from '@react-three/drei';
import type { CalendarYearsData, CalendarWeekData } from '~/types';
import { useGridCalculations } from '~/hooks';
interface TitanicGridsProps {
/** The list of number values per calendar year. */
data: CalendarYearsData;
/** The first year in the dataset. */
startYear: number;
/** The maximum value in the dataset. */
maxValue: number;
}
/** Shows a grid of 3D bar charts to represent the number values per year. */
const TitanicGrids: FC<TitanicGridsProps> = ({ data, startYear, maxValue }) => {
const id = useId();
// START: The temporary values for the grid.
/** The size of each cell in the grid. */
const cellSize = 1.0;
/** The spacing between each cell in the grid. */
const cellSpacing = 0.2;
/** The spacing between each grid in the scene. */
const gridSpacing = 1.4;
/** The color of the cells. */
const color = '#a0185a';
/** The color of the unused cells. */
const unusedColor = '#cccccc';
/** The scale of the cells. */
const scale = 20.0;
/** Whether the camera should rotate or not. */
const rotate = true;
/** The speed of the camera rotation. */
const speed = 1.0;
/** The position of the camera. */
const camera: [number, number, number] = [-50, 25, 29];
/** Temporary interface for the light values. */
interface LightValues {
/** The position of the light. */
position: [number, number, number];
/** The intensity of the light. */
intensity: number;
/** The color of the light. */
color: string;
/** Whether the light is enabled or not. */
enable: boolean;
}
/** The values for the first light. */
const light1: LightValues = {
position: [90, 0, 0],
intensity: 0.8,
color: '#ffffff',
enable: true
};
/** The values for the second light. */
const light2: LightValues = {
position: [-180, 0, 0],
intensity: 0.8,
color: '#ffffff',
enable: true
};
// END: The temporary values for the grid.
const { calcCellHeight, calcGridPosition, calcCellPosition, center } = useGridCalculations(
data,
gridSpacing,
cellSize,
cellSpacing,
scale,
maxValue
);
return (
<>
<Canvas>
<OrbitControls autoRotate={rotate} autoRotateSpeed={speed} target={center} />
<PerspectiveCamera makeDefault position={camera} />
<hemisphereLight />
{light1.enable && (
<directionalLight
position={light1.position}
intensity={light1.intensity}
color={light1.color}
/>
)}
{light2.enable && (
<directionalLight
position={light2.position}
intensity={light2.intensity}
color={light2.color}
/>
)}
{data.map((yearData, yearIndex) => {
const forYear = startYear + yearIndex;
const gridPosition = calcGridPosition(yearIndex);
return (
<group key={`${id}-grid-${forYear}`} position={gridPosition}>
{yearData.map((week: CalendarWeekData, weekIndex: number) => {
return week.map((value: number, dayIndex: number) => {
const cellHeight = calcCellHeight(value);
const cellPosition: [number, number, number] = [
calcCellPosition(dayIndex),
cellHeight / 2,
calcCellPosition(weekIndex)
];
return (
<Box
key={`${id}-grid-${weekIndex}-${dayIndex}`}
args={[cellSize, cellHeight, cellSize]}
position={cellPosition}
>
<meshPhongMaterial color={value < 0 ? unusedColor : color} />
</Box>
);
});
})}
</group>
);
})}
</Canvas>
</>
);
};
export default TitanicGrids;

This component is more complex than the previous one, so let's break it down.

Here's a brief overview of the 3D components we imported:

  • The Canvas component from @react-three/fiber renders the 3D scene.
  • The PerspectiveCamera simulates human perception by projecting the 3D scene onto a 2D plane, creating depth by making objects appear smaller as they recede into the distance.
  • The OrbitControls helper enables interaction with the 3D scene using mouse or touch inputs, providing an intuitive way to navigate the 3D space through panning, zooming, and orbiting.
  • The hemisphereLight and directionalLight add lighting to the scene.
  • The Box component is a convenient wrapper for rendering cuboid shapes.
  • The meshPhongMaterial is a type of material suitable for 3D objects with shiny surfaces.

Here's an explanation of the position and dimension calculations:

3D Plane Calculation

  • The calcCellHeight function calculates Box heights based on their value, the maximum value in the dataset, and the scale factor. The final height is determined by dividing the cell value by the maximum value, and then multiplying by the scale factor. This ensures that each cell's height is proportional to its value compared to the maximum value in the data set.
  • The calcCellPosition calculates the distance of a cell from point [0, 0, 0] of a grid. It takes in an index value and multiplies it by the sum of the cellSize and cellSpacing values. This ensures that each cell is consistently spaced from the previous cell along the X- and Z-axes. We add half the cell size to the result to ensure that the cell starts at the correct position since objects are positioned from their center.
  • The calcGridPosition calculates the position of each year's grid in the 3D space. The X-coordinate is determined by multiplying the index of the year by the total width of the 7 columns of cells (including cell spacing), and then by the gridSpacing value. This ensures that each year's grid is consistently spaced from the previous grid along the X-axis.
  • We can then calculate for the center of the Canvas by calculating the gridWidth (7 cells for 7 days) and gridLength (54 cells for 54 weeks) and then dividing each by 2. This gives us the center of the grid, which we can use to center the camera and the orbit controls.

Now, update the index page to use the new component:

src/pages/index.tsx

import type { NextPage, GetServerSideProps } from 'next';
import Head from 'next/head';
import { parse as parseYaml } from 'yaml';
import { convertChaptersToMapping, convertToCalendarYearData } from '~/utils';
import type { Chapter, CalendarYearsData } from '~/types';
import TitanicGrids from '~/components/TitanicGrids';
const URL = `https://raw.githubusercontent.com/wandering-inndex/seed-data/main/data/media/twi-webnovel-chapters.yaml`;
interface HomeProps {
/** The list of word counts per calendar year. */
data: CalendarYearsData;
/** The minimum year in the dataset. */
minYear: number;
/** The maximum value in the dataset. */
maxValue: number;
}
const Home: NextPage<HomeProps> = ({ data, minYear, maxValue }) => {
return (
<>
<Head>
<title>Titan</title>
<meta name="description" content="Visualize contribution charts in 3D" />
<link rel="icon" href="/favicon.ico" />
</Head>
<main className="h-screen w-screen p-1">
<nav className="absolute left-1/2 z-10 mx-auto my-4 -translate-x-1/2 text-center text-4xl font-bold">
Titan
</nav>
<TitanicGrids data={data} startYear={minYear} maxValue={maxValue} />
</main>
</>
);
};
export const getServerSideProps: GetServerSideProps<HomeProps> = async () => {
const res = await fetch(URL);
const text = await res.text();
const chapters: Chapter[] = parseYaml(text) as Chapter[];
const { mapping, minYear, maxValue } = convertChaptersToMapping(chapters);
const data = convertToCalendarYearData(mapping);
return {
props: {
data,
minYear,
maxValue
}
};
};
export default Home;

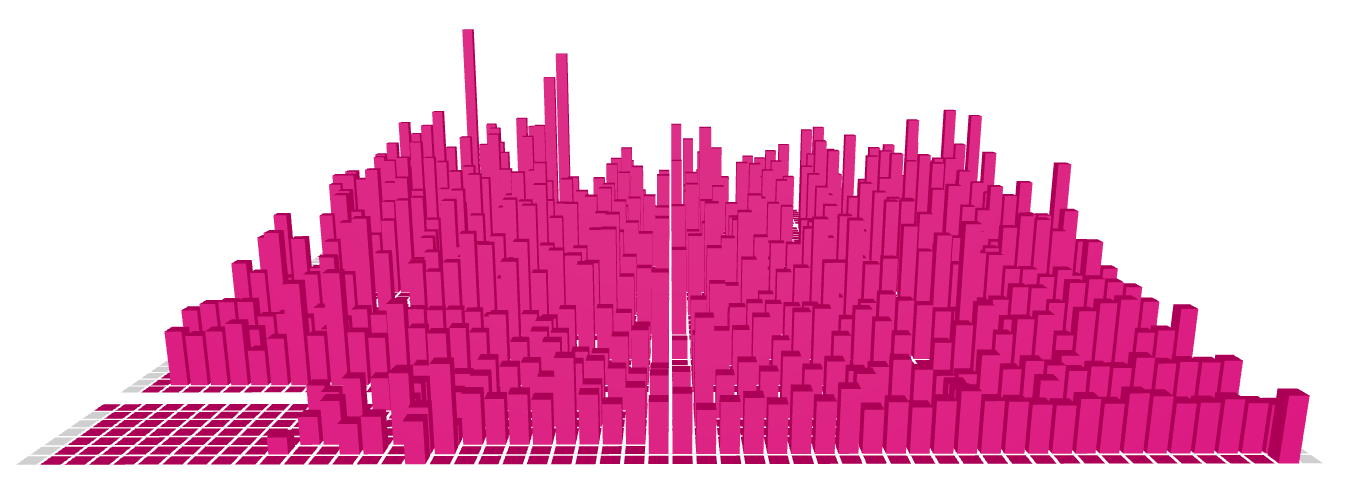
Running the app now should display something like this:

Add 3D Chart

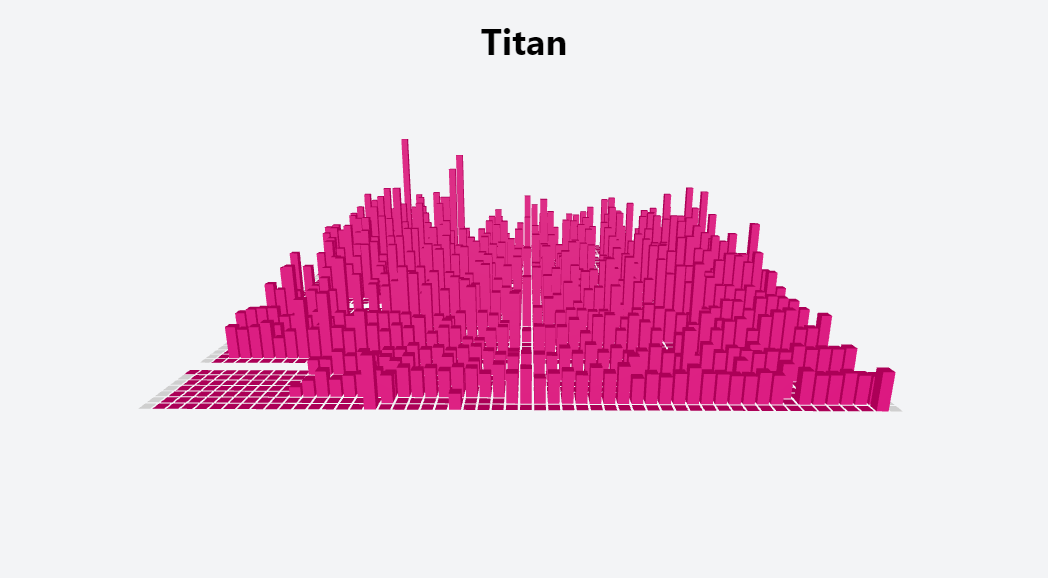
You can move the camera around by clicking and dragging the left mouse button or using touch inputs. Zoom in and out by scrolling the mouse wheel or pinching the screen. Pan the camera using the right mouse button or a two-finger drag.

##Step 6: Adding a helper GUI to customize the chart

We're nearly finished! To make our chart easier to customize, let's add one more library.

Open the src/components/TitanicGrids.tsx file and update it with the following:

src/components/TitanicGrids.tsx

import { type FC, useId } from 'react';
import { Canvas } from '@react-three/fiber';
import { Box, PerspectiveCamera, OrbitControls } from '@react-three/drei';
import { useControls, Leva } from 'leva';
import type { CalendarYearsData, CalendarWeekData } from '~/types';
import { useGridCalculations } from '~/hooks';
interface TitanicGridsProps {
/** The list of number values per calendar year. */
data: CalendarYearsData;
/** The first year in the dataset. */
startYear: number;
/** The maximum value in the dataset. */
maxValue: number;
}
/** Shows a grid of 3D bar charts to represent the number values per year. */
const TitanicGrids: FC<TitanicGridsProps> = ({ data, startYear, maxValue }) => {
const id = useId();
const { cellSize, cellSpacing, gridSpacing, color, unusedColor, scale } = useControls('Cells', {
/** The length of each cell in the grid. */
cellSize: {
value: 1.0,
step: 0.05,
min: 1.0
},
/** The spacing between each cell in the grid. */
cellSpacing: {
value: 0.2,
step: 0.05,
min: 0.1
},
/** The scale of the cells. */
scale: {
value: 20.0,
step: 1.0,
min: 0.0
},
/** The spacing between each grid in the scene. */
gridSpacing: {
value: 1.4,
step: 0.05,
min: 0.1
},
/** The color of the regular cells. */
color: '#a0185a',
/** The color of the unused cells. */
unusedColor: '#cccccc'
});
const { rotate, speed, camera } = useControls('Controls', {
/** The position of the camera. */
camera: [-50, 25, 29],
/** Whether the camera should rotate or not. */
rotate: true,
/** The speed of the camera rotation. */
speed: {
value: 1.0,
step: 0.1,
min: 0.0
}
});
const light1 = useControls('Light 1', {
/** The position of the light. */
position: {
value: [90, 0, 0],
step: 10
},
/** The intensity of the light. */
intensity: {
value: 0.8,
step: 1.0
},
/** The color of the light. */
color: '#ffffff',
/** Whether the light is enabled or not. */
enable: true
});
const light2 = useControls('Light 2', {
/** The position of the light. */
position: {
value: [-180, 0, 0],
step: 10
},
/** The intensity of the light. */
intensity: {
value: 0.8,
step: 1.0
},
/** The color of the light. */
color: '#ffffff',
/** Whether the light is enabled or not. */
enable: true
});
const { calcCellHeight, calcGridPosition, calcCellPosition, center } = useGridCalculations(
data,
gridSpacing,
cellSize,
cellSpacing,
scale,
maxValue
);
return (
<>
<Leva collapsed={false} />
<Canvas>
<OrbitControls autoRotate={rotate} autoRotateSpeed={speed} target={center} />
<PerspectiveCamera makeDefault position={camera} />
<hemisphereLight />
{light1.enable && (
<directionalLight
position={light1.position}
intensity={light1.intensity}
color={light1.color}
/>
)}
{light2.enable && (
<directionalLight
position={light2.position}
intensity={light2.intensity}
color={light2.color}
/>
)}
{data.map((yearData, yearIndex) => {
const forYear = startYear + yearIndex;
const gridPosition = calcGridPosition(yearIndex);
return (
<group key={`${id}-grid-${forYear}`} position={gridPosition}>
{yearData.map((week: CalendarWeekData, weekIndex: number) => {
return week.map((value: number, dayIndex: number) => {
const cellHeight = calcCellHeight(value);
const cellPosition: [number, number, number] = [
calcCellPosition(dayIndex),
cellHeight / 2,
calcCellPosition(weekIndex)
];
return (
<Box
key={`${id}-grid-${weekIndex}-${dayIndex}`}
args={[cellSize, cellHeight, cellSize]}
position={cellPosition}
>
<meshPhongMaterial color={value < 0 ? unusedColor : color} />
</Box>
);
});
})}
</group>
);
})}
</Canvas>
</>
);
};
export default TitanicGrids;

We're using the leva library to add a helper panel on the right side of the screen. This floating panel enables real-time modification of the grid's appearance.

Customize 3D Chart

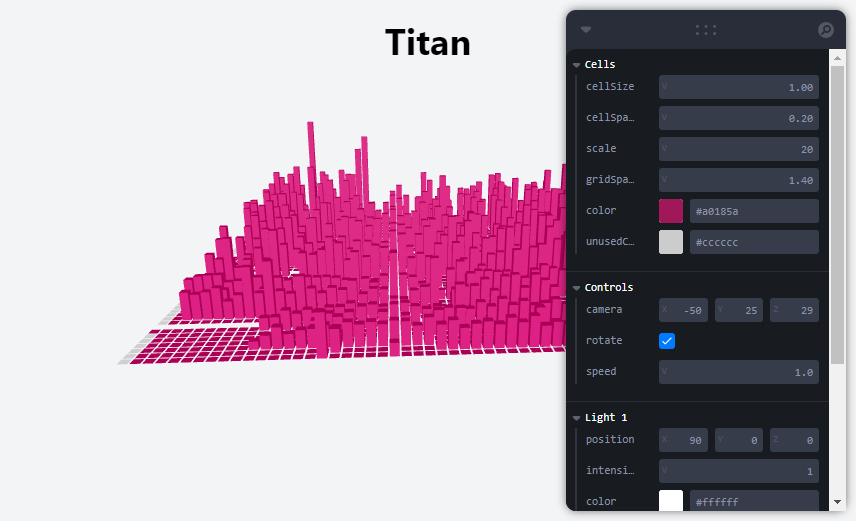
We can change the size of the cells, the spacing between them, the color of the cells, and more. We can also enable/disable the camera rotation and change its speed. We can also enable/disable the two lights in the scene and change their position, intensity, and color. The panel also shows the current values of the controls. This is very useful for debugging and tweaking the grid's appearance.

##Conclusion

Give yourself a pat on the back! We have successfully created a 3D grid visualization for time-series data using React Three Fiber. You can find the live version at The Wandering Inndex and the full source code on the wandering-inndex/titan repository.

Let's review the steps we took:

  1. Project Setup: We initialized a new React project using Create T3 App and installed the required dependencies.
  2. Preparing our Data: We retrieved the raw dataset and transformed it into a suitable format for analysis.
  3. Creating the Time-series Data: We further transformed the data, organizing it by year and week. We also learned about the ISO 8601 standard and adapted it to our needs.
  4. Show the data in a 2D Grid: We began visualizing the data in a simple 2D grid format to understand the data structure and prepare for the next step.
  5. Show the Data in a 3D Grid: We built upon the 2D grid to create a 3D grid representing data points, providing a more visually appealing representation of the time-series data.
  6. Adding a helper GUI to customize the chart: We added a helper interface that allows real-time customization of the grid elements' appearance and behavior.

This tutorial serves as a starting point for what you can achieve with React Three Fiber. Potential enhancements could include:

  • Adding tooltips and labels to show more information about each bar when hovering.
  • Adding animations to the bars like a growing animation when the data is first loaded.
  • Adding filters to enable users to modify the displayed data in real-time.

I encourage you to experiment with the code and build upon it to create your own unique 3D grid visualizations.

Happy coding!

© 2021 Nap Joseph Calub. All rights reserved.

Light Mode
Dark Mode